 Image: Wolfmann, CC BY-SA 4.0
How a statistical office measures inflation
The United Kingdom's Office for National Statistics collects about 180,000 prices every month, for around 700 goods and services, in about 140 locations and online, and combines them into a single number that it publishes on a Wednesday morning at seven. The number is the consumer price index, the twelve-month change in it is the inflation rate, and in the twelve months to October 2022 it was 11.1 per cent, the highest in forty years. Pensions, benefits, rail fares, index-linked bonds, and the Bank of England's target all hang on it. It is worth knowing how it is made.
The basket
A price index answers the question: how much more does it cost this month to buy what a typical household bought in the base year? The first step is to decide what that household bought, which is done from a survey of household spending. In the United Kingdom this is the Living Costs and Food Survey, in which several thousand households keep a diary of everything they buy for two weeks. The survey gives the shares of spending on food, housing, transport, clothing, and so on, down to fine categories, and these shares become the weights of the index. Food and non-alcoholic drinks are about 11 per cent of the UK basket, transport about 13 per cent, and housing and household services around 30 per cent, the exact figures changing a little each year. Within each category the office chooses representative items whose prices can be collected consistently: a particular size of loaf, a litre of semi-skimmed milk, a men's haircut, a cinema ticket. The list is revised every year, which is the source of the annual newspaper stories about vinyl records entering the basket and DVD players leaving it.
The collection
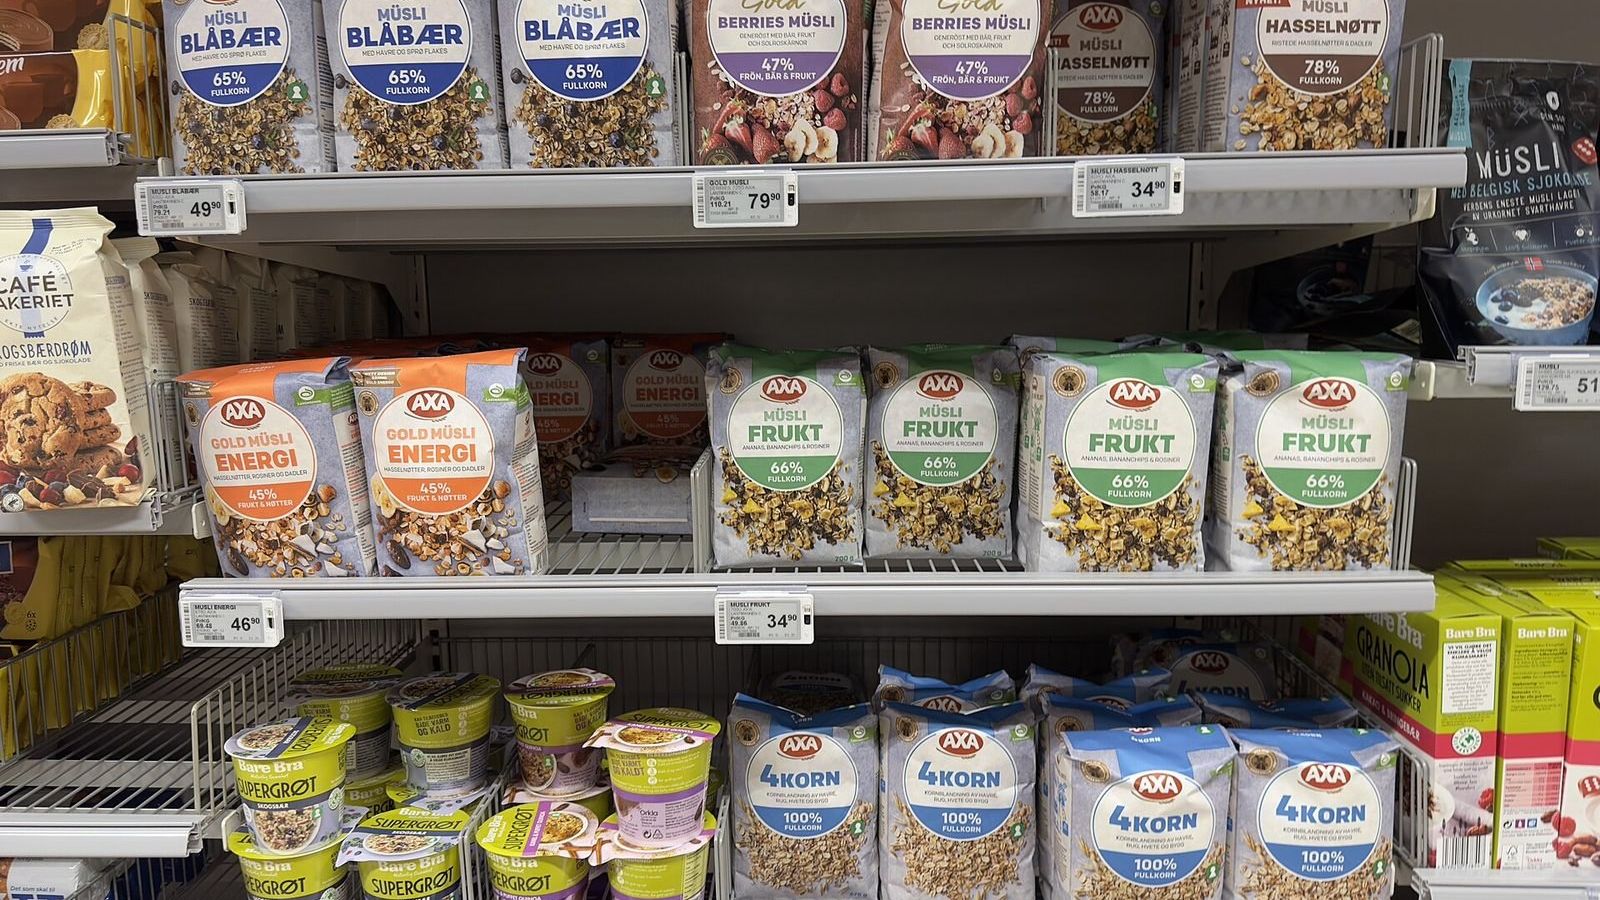
Most prices are still collected by people walking into shops with a handheld device and recording what the shelf label says for a specified item in a specified store, the same store every month. Prices that are the same everywhere, such as a stamp or a rail fare, are collected centrally. Increasingly the offices use scanner data from retailers and prices scraped from websites, which give millions of observations rather than thousands and let the index follow what people actually bought rather than a representative item. The technical manual of the Office for National Statistics describes every step, and Eurostat's page on the harmonized index does the same for the euro area version that the European Central Bank targets.
The formula
With the prices in hand, the office computes, for each item, the ratio of this month's price to the base price, averages the ratios within each category, and combines the categories with the expenditure weights. The result is an index set to 100 in the base year, and inflation is its percentage change over twelve months. Unit 7 of the masterclass works through a small basket by hand, which is the fastest way to see what the weights do: a 20 per cent rise in the price of something that is 2 per cent of spending adds 0.4 percentage points to inflation, while a 5 per cent rise in rent, at 15 per cent of spending, adds 0.75.
Why the number is biased, and in which direction
A fixed basket overstates the rise in the cost of living, for three reasons that statisticians have known since the 1950s. The first is substitution. When the price of beef rises and the price of chicken does not, households buy more chicken, and the cost of the meals they actually eat rises by less than the cost of the old basket. An index with fixed weights ignores the switch. The second is quality. A phone that costs the same as last year's model and does twice as much is a price cut in disguise, and the office has to decide how much of the price to attribute to the improvement, a procedure called hedonic adjustment that is applied to computers, cars, and clothing with varying success. The third is new goods, which enter the basket years after they appear and after their steepest price falls. A commission chaired by Michael Boskin estimated in 1996 that the United States consumer price index overstated inflation by about 1.1 percentage points a year from these sources, and the methods have improved since, with most estimates of the remaining bias in rich countries between a quarter and three quarters of a percentage point.
Alberto Cavallo and Roberto Rigobon's Billion Prices Project, the research spotlight of Unit 7, used prices scraped daily from online retailers in dozens of countries to build independent indices, and found that they tracked the official ones closely almost everywhere. The exception was Argentina between 2007 and 2015, where the online index ran at roughly twice the official rate, which confirmed what everybody in Buenos Aires already knew about the official statistics of those years.
Why your inflation is different
The index is for an average household, and no household is average. A pensioner who spends a third of their income on heating experienced 2022 very differently from a student whose largest expense was a rent fixed in 2021. The Office for National Statistics publishes indices for different household types for exactly this reason, and anyone can compute their own by applying their own weights to the published category indices. The gap between the headline rate and a person's experience is usually about weights, and sometimes about the fact that people notice the prices that rise and forget the prices that fall.
A worked number
Take a basket of three things. Rent is 40 per cent of spending and rises 3 per cent. Food is 20 per cent and rises 10 per cent. Everything else is 40 per cent and rises 1 per cent. Inflation is 0.4 × 3 + 0.2 × 10 + 0.4 × 1, which is 1.2 + 2.0 + 0.4, or 3.6 per cent. Now suppose that within food the price of one staple doubled while the rest rose 5 per cent, and that the household cut its purchases of the staple by half. The fixed-weight food index says 10 per cent; the cost of the food the household actually bought rose by less, perhaps 8 per cent, which brings the total to 3.2 per cent. The 0.4 percentage point difference is substitution bias, and it is the order of magnitude the Boskin commission was arguing about.
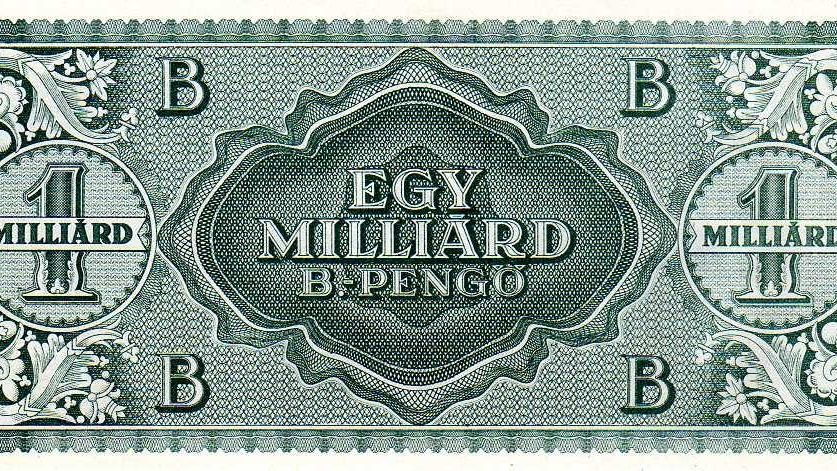
Unit 7 of the masterclass, Measuring the Economy, treats the consumer price index alongside GDP and the unemployment rate as measurements with a method, and its weekly dataset is Eurostat, where the Statistics Explained articles give the recipe for every number next to the number itself. The post on the Hungarian hyperinflation shows what measurement looks like when prices change between the morning and the afternoon.