

Business Cycles and Stabilization Policy
The unit builds the model macroeconomists use to argue about recessions. It shows how the NBER dates a downturn and why months late, reads Okun's law from seventy years of data, and uses aggregate demand and aggregate supply to separate the demand shock of 2008 from the oil shock of 1973 and the disputed inflation of 2021 to 2023. It derives the spending multiplier and confronts it with the estimates of the decade after 2008, sizes the stimulus packages of 2009 and 2020, follows the Fed from the Taylor rule to the zero lower bound and quantitative easing, and ends with the Phillips curve, its breakdown in the 1970s, and the price of the Volcker disinflation.
On 8 June 2020 a committee of eight economists announced that the United States had entered a recession in February of that year, at a moment when almost everyone had known it for three months, and on 19 July 2021 the same committee announced that the recession had ended in April 2020, fifteen months after the fact. Dating a downturn turns out to be the easy part. The hard questions are why a fall in spending throws millions out of work instead of merely lowering prices, how much a government can do about it with its budget and a central bank with its interest rate, and why the cure for one kind of recession makes another kind worse. This unit builds the model that macroeconomists use to argue about these questions, the diagram of aggregate demand and aggregate supply, and tests it against the three downturns that run through the whole unit, the Great Depression (1929 to 1939), the Great Recession (2007 to 2009), and the recession of 2020.
1 Booms, recessions, and how they are dated
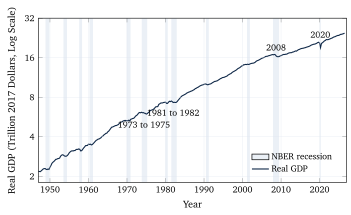
Figure 1 shows the real GDP of the United States since 1947 on a logarithmic scale, so that a straight line means a constant growth rate, as Unit 1 explained. Two features stand out. The first is the trend. It has carried output from 2.2 trillion to 24.6 trillion US dollars of 2017 purchasing power, which means a growth of about 3 per cent a year on average, and Unit 8 examined its causes. The second is the set of grey bands, which mark twelve interruptions in which output fell and then recovered. The business cycle is this alternation of expansions and contractions around the trend. The word “cycle” is a little misleading, because the interruptions come at irregular intervals, from one year to ten, and have no fixed length. Economists keep the word anyway.
1.1 The committee that dates recessions
In the United States the dates of the bands are set by the Business Cycle Dating Committee of the National Bureau of Economic Research (NBER), a private research organization in Cambridge, Massachusetts, whose committee of eight academic economists has dated the cycle since 1978 and whose list of turning points runs back to 1854. The committee defines a recession as a significant decline in economic activity that is spread across the whole economy and lasts more than a few months, and it dates the month of the peak, when activity was highest, and the month of the trough, when it stopped falling. The recession is the stretch between them; everything else is an expansion. A popular rule of thumb says that two consecutive quarters of falling real GDP make a recession. That rule is not the committee’s definition, and the two can disagree. In 2001 real GDP never fell in two quarters in a row, and the committee dated a recession from March to November all the same, because employment and industrial production fell for most of the year. The first half of 2022 is the opposite case. The first estimates showed real GDP falling in both quarters, and after revision the data show a fall in the first quarter and a barely positive second quarter; no recession was declared either way, because employment grew strongly throughout.
The committee looks at monthly series rather than at quarterly GDP. The most important are real personal income excluding government transfers (payments such as pensions and unemployment benefits), employment measured both from the payrolls of firms and from the survey of households, real consumer spending, and industrial production. The committee then waits until the data have been revised and the turning point is beyond doubt. That is why the announcements come late. The peak of December 2007 was announced on 1 December 2008, the trough of June 2009 on 20 September 2010, and the trough of April 2020 on 19 July 2021. The delay is a choice, because the committee would rather be slow than wrong, and a date, once announced, is not revised.