

Growth and the Wealth of Nations
Income per head in the world rose about fifteenfold in two centuries after millennia without growth, and the gap between the richest and poorest countries grew to a factor of about 80. This unit explains the growth with the production function, growth accounting, and the Solow model, shows why ideas escape the diminishing returns that machines face, and uses the two Koreas and the mortality of colonial settlers to argue that institutions are a fundamental cause of prosperity. It closes the Foundation masterclass with the Malthusian trap, the escape from it, and the big picture of what economics has explained.
In 1820 the average person on Earth produced goods and services worth about 1,100 dollars a year, in international dollars of 2011, which compare countries at the purchasing power parity that Unit 7 explained, and three people in four could not afford the food, clothing, and shelter that a statistician would call basic needs. In 2022 the average was about 16,700 dollars, fifteen times as much, and the share in extreme poverty had fallen to one in ten. The gain was not shared evenly. An average American today has about eighty times the income of an average Burundian, and two countries that were one until 1945, North and South Korea, differ by a factor of between 25 and 30. Nothing in the first seven units has a larger effect on how people live than the growth rates behind these numbers, and this unit asks three questions about them. Why did growth begin after thousands of years without it, what keeps it going, and why has it reached some countries and not others?
1 Two centuries of growth
Figure 1 shows GDP per head of six countries since 1820. The numbers come from the Maddison Project Database, the long-run collection of national income estimates that is maintained at the University of Groningen, and they are drawn on the logarithmic scale of Unit 1, so that a straight line means a constant growth rate and two lines with equal slopes grow at equal rates. Several facts about growth can be read from the figure.
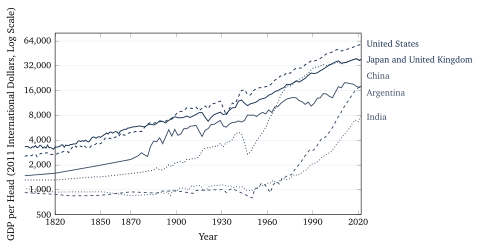
The first fact is the shape that economic historians call the hockey stick. Before about 1800 income per head moved within a narrow band for centuries in almost every country, and even in Britain and the Netherlands, where it had begun to rise, the gains were slow by later standards. The earliest estimates in the database put China in 1820 at 882 dollars, India at about 940, and Japan at 1,317, which places the three within a factor of two of each other and not far above the roughly 1,100 dollars of the world as a whole. For the world, the series then rises to 1,543 dollars in 1870, 3,360 in 1950, 8,211 in 1990, and 16,677 in 2022. A rise by a factor of 14.8 in 202 years is an average growth rate of only 1.3 per cent a year, which shows how much compounding can do over two centuries, and since 1950 the world rate has been about 2.2 per cent a year.
The second fact is that the rich countries grew steadily rather than fast. The United States went from 2,674 dollars in 1820 to 58,487 in 2022, which is a factor of 22 and an average growth rate of only 1.5 per cent a year. The third fact is that the countries that caught up did so at rates the leaders never reached. Japan grew from 3,062 dollars in 1950 to 29,949 in 1990, which is 5.9 per cent a year for forty years, and China from 799 dollars in 1950 to 19,238 in 2022. The fourth fact is that growth is not guaranteed. Argentina had 74 per cent of British income per head in 1913 and has 48 per cent today, and the Democratic Republic of the Congo, in central Africa, had 909 dollars per head in 1950 and 844 in 2022.
The gap between the richest and the poorest countries is the fifth fact. In 2022 the United States had 58,487 dollars per head and Burundi, in East Africa, had 717 dollars, which is a ratio of 82, and the Central African Republic was lower still at 596 dollars. In 1820 the richest country in the database, the United Kingdom with 3,306 dollars, had only about five times the income of the poorest country for which an estimate exists, which was Nepal with 641 dollars. Two centuries of unequal growth rates created today’s gap, and the rule of 70 says how fast it can close.