 Image: NASA, public domain
What the night sky over Korea tells an economist
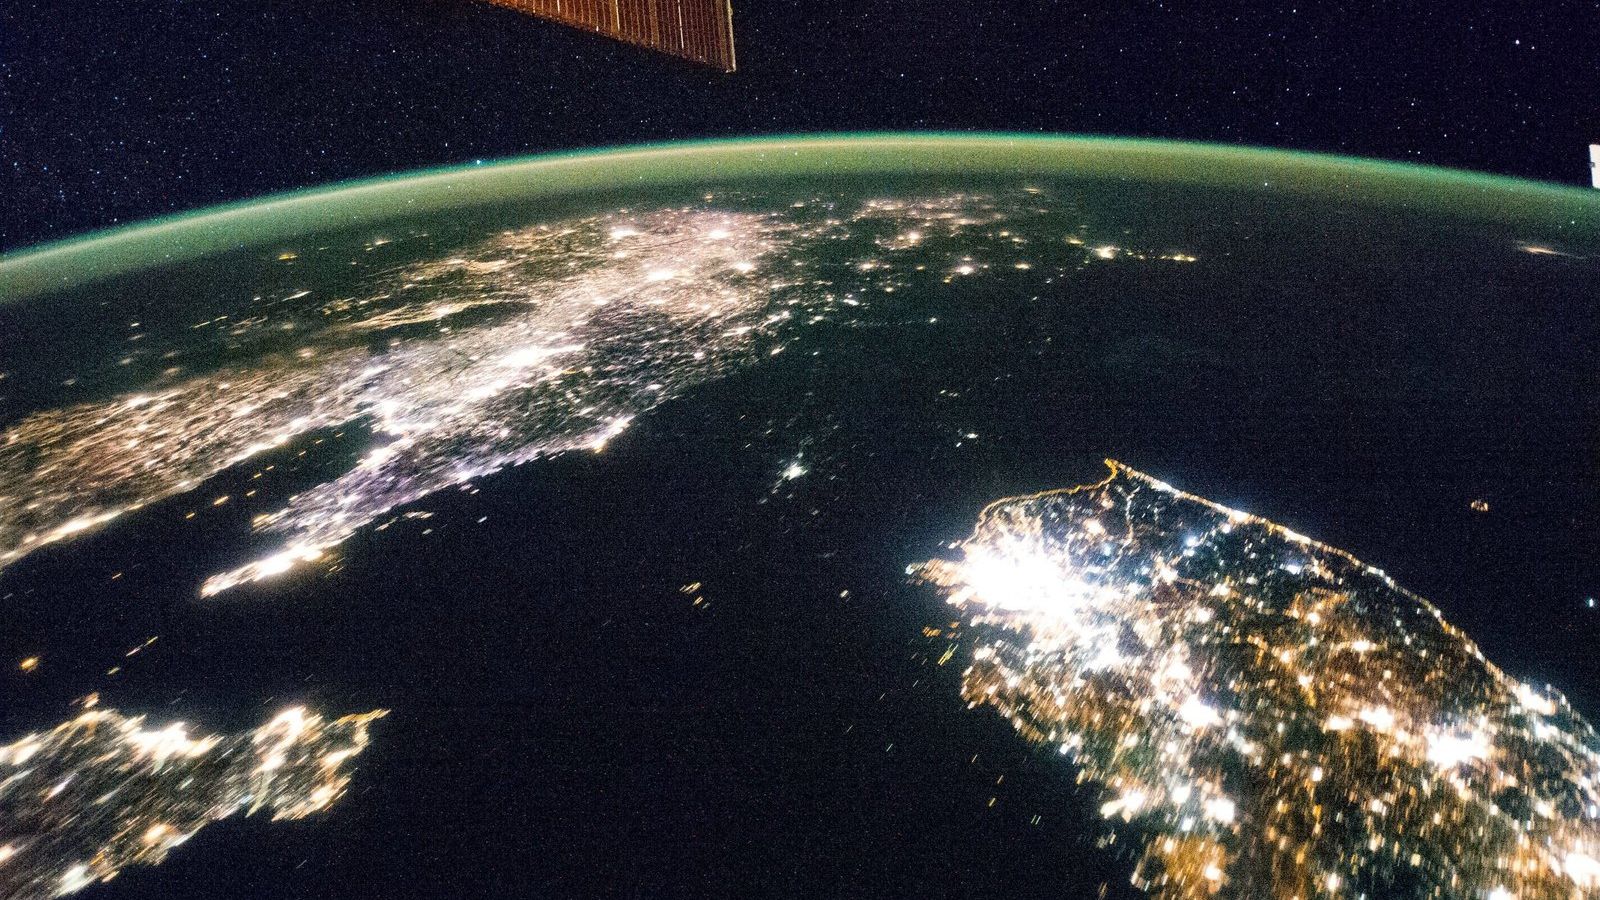
The photograph at the top of this page was taken on 30 January 2014 by a crew member of the International Space Station. The large bright patch is Seoul, the other lights are the rest of South Korea, the glow at the top is China, and between them is a dark space the size of England with a single faint point of light at Pyongyang. From orbit the two Koreas look like a country and the sea next to it. They are the same peninsula, the same people, the same language, and the same climate, and in 1945 they had the same income.
The division
Korea was a Japanese colony from 1910 to 1945. When Japan surrendered, the United States and the Soviet Union divided the peninsula along the 38th parallel for the purposes of accepting the surrender, and the line hardened into a border within three years. The division was drawn in a hurry, by two American officers using a map from a magazine, with no regard to where the industry, the farmland, or the richer regions were. If anything the North had the advantage, with most of the colonial heavy industry, the mines, and the hydroelectric power; the South had more people and more rice. The war of 1950 to 1953 devastated both. In the late 1950s the North, rebuilt with Soviet help, was by most estimates slightly richer per head than the South.
The divergence
According to the Maddison Project Database, South Korea's GDP per head in 1960 was about 1,500 dollars in 2011 international prices, roughly the level of Ghana at the time. By 2018 it was about 37,000 dollars, a factor of 25 in under sixty years and a growth rate averaging about 5.5 per cent a year per head, which by the rule of 70 is a doubling every thirteen years. North Korea does not publish national accounts, and every number for it is an estimate; the Bank of Korea, the South's central bank, produces an annual estimate from what can be observed, and its recent figures put the South's income per head at about thirty times the North's. The United Nations and other sources give ratios between fifteen and thirty depending on the method, and the honest statement is that the gap is somewhere in that range and that a famine in the 1990s killed several hundred thousand people in the North, with some estimates far higher. The lights in the photograph are a rough measure of economic activity, and researchers have used satellite images of night lights to estimate output where statistics are missing or unreliable, North Korea being the leading case.
What the comparison proves
Economists love the Korean case because it rules things out. The usual explanations for why some countries are rich and others poor include geography, climate, culture, religion, natural resources, and colonial history, and the two Koreas hold all of those constant. What differed after 1948 was the set of rules under which people lived and worked: in the South, private property, markets, contracts enforced by courts, trade with the rest of the world, and from 1987 a democracy; in the North, state ownership, central planning, closed borders, and a hereditary dictatorship. The economic word for such rules is institutions, and the Korean case is as close as history comes to assigning two institutional regimes at random to two halves of one population and waiting sixty years for the result.
Daron Acemoglu, Simon Johnson, and James Robinson, who shared the 2024 Nobel prize in economic sciences for their work on institutions and prosperity, use Korea in this way in their books and papers, and the research spotlight of Unit 8 of the masterclass presents their 2001 study of former colonies, which uses a very different natural experiment, the death rates of European settlers, to reach the same conclusion on a sample of sixty countries. The Royal Swedish Academy's press release on the prize puts the argument in two pages.
What it cannot prove
A good student should also know the limits. Korea is one comparison, and a sample of one proves nothing on its own; it is persuasive because it is so clean, and because it fits a larger body of evidence. It shows that institutions can matter enormously, and says little about which institutions matter most, in what order, or how a country acquires them, which are the questions that development economists actually argue about. South Korea's rise took place under a military government from 1961 to 1987 that directed credit, protected industries, and suppressed unions, so the case is not a simple demonstration that free markets alone did the work, and the Chinese case since 1978 complicates the picture further. The comparison also says nothing about the role of aid, since both halves received a great deal from their respective patrons in the early decades. And the brightness of lights measures the use of electricity, which correlates with income strongly across countries and imperfectly within them.
A worked number
Suppose, generously, that the two Koreas had equal incomes per head in 1960 and that the South then grew at 5.5 per cent a year per head and the North at 1 per cent. After 60 years the South's income has multiplied by 1.055 to the power 60, which is about 25, and the North's by 1.01 to the power 60, which is about 1.8. The ratio is about 14. To reach a ratio of 30 the North would have to have grown at essentially zero over the whole span, with the growth of the 1960s cancelled by the collapse of the 1990s, which is roughly what the estimates suggest. The point of the arithmetic is that a gap of this size needs no catastrophe in any one year; a difference of 4 to 5 percentage points in the growth rate, sustained for two generations, produces it on its own. That is the rule of 70 applied in the other direction, and it is why Unit 8 opens with two centuries of income on a log scale before it turns to the causes.
The photograph is the hero image of Unit 8 of the masterclass, Growth and the Wealth of Nations, which closes the Foundation masterclass with the question of why some countries grew rich and others did not. The weekly dataset of that unit is Our World in Data, where the long Korean series can be plotted in a minute, on a log scale, next to any country you like.